Okay, can we just be real for a second? When someone says “data visualization” or “business intelligence,” my brain used to instantly conjure images of guys in gray suits staring at green numbers on a black screen. Not exactly the stuff of cozy coffee chats, right? But here’s the thing—I’ve had a total heart-to-heart with data over the past year, and I’m honestly a little embarrassed to admit how much it’s changed my life. Not just at work, but in my everyday chaos. So grab your favorite mug, settle in, and let me tell you how I went from “data-phobic” to “data-curious” without losing my soul.
Why I Started Caring About Data Visualization (It’s Not Just for Nerds)
It all started with a meltdown. I was trying to plan my monthly budget—something I’ve always been terrible at—and I had a sticky note explosion on my fridge. Numbers everywhere. Groceries, subscriptions, that random yoga class I swore I’d attend. I felt like I was drowning in a sea of digits. Then a friend (who’s a total spreadsheet wizard) said, “Emma, just make a simple chart. Your brain isn’t built for raw numbers—it’s built for patterns.”
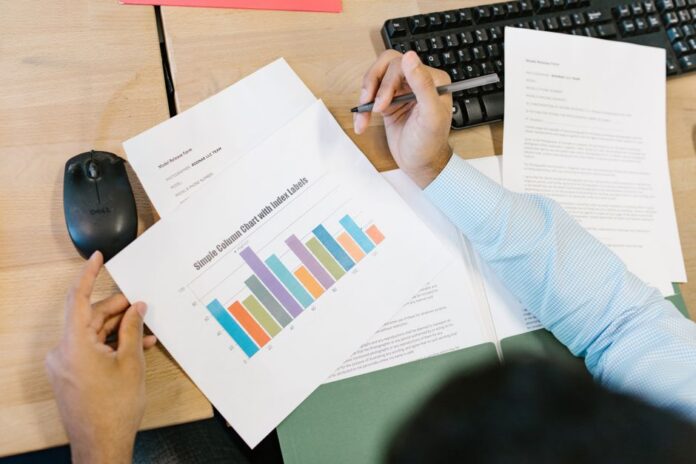
So I did. I took my messy list and turned it into a color-coded bar chart. And you guys? It was like a lightbulb went off. Suddenly I could see that my “little” coffee runs were actually a giant black hole in my wallet. That’s data visualization in a nutshell—it takes all that scary, jumbled information and turns it into a story you can actually read. At work, I started using it to show my team how our social media posts were performing. Instead of saying “engagement is up,” I showed them a line graph that looked like a happy mountain climbing upward. They got it immediately. No jargon, no confusion. Just a picture that said everything.
I even started playing with tools like Canva’s chart maker and Google Sheets’ built-in graphs. It’s not about being a tech genius—it’s about being kind to your future self. When you can see your data, you can actually feel what’s happening. And that’s a game-changer for anyone, whether you’re running a business or just trying to figure out why your electricity bill is so high.
Predictive Analytics and KPI Tracking: The Real-Life Crystal Ball
Now let’s talk about the stuff that sounds super sci-fi but is actually super practical: predictive analytics and KPI tracking. I know, I know—it sounds like something from a tech conference. But let me tell you about my friend Jenna. She runs a small bakery, and she was always guessing how many croissants to bake. Some days she’d have a mountain of leftovers, other days she’d sell out by 9 a.m. and miss out on customers. She was stressed, tired, and honestly, losing money.
One afternoon over iced lattes, I showed her how to track a simple KPI: daily sales by hour. She started logging it in a notebook (yes, old-school, but it works). After two weeks, she noticed a pattern—Saturdays were always busier after 10 a.m., and rainy Tuesdays were dead. Using that data, she started predicting how many croissants to bake. She even added a “rainy day special” to boost slow hours. Her waste dropped by 40%, and her profits went up. That’s predictive analytics in action—using past data to guess what’s coming next. It’s not magic; it’s just paying attention to the clues life gives you.
For me, I started tracking my own KPIs—not for a business, but for my personal goals. I wanted to write more, so I tracked how many words I wrote each day. I wanted to sleep better, so I logged my bedtime. The numbers didn’t lie. I saw that I wrote best in the morning and that my sleep tanked when I scrolled my phone before bed. That tiny bit of awareness helped me make small changes that added up to big results. KPI tracking isn’t about being perfect—it’s about being honest with yourself so you can adjust your sails.
Big Data and Business Intelligence: How I Stopped Feeling Overwhelmed
Okay, deep breath. “Big data” and “business intelligence” are two phrases that used to make me want to hide under a blanket. But here’s the truth I’ve learned: big data just means “a lot of information,” and business intelligence is just “using that information to make better choices.” That’s it. No secret handshake required.
I remember a time when I was helping a friend plan a community event. We had so many details—RSVPs, weather forecasts, vendor costs, volunteer schedules. It was chaos. But instead of panicking, I sat down and made a simple dashboard (just a list of key numbers in a spreadsheet). I tracked: how many people said yes, what the weather looked like, and how much we’d spent so far. That was my tiny version of business intelligence. It helped me see that we needed to order more chairs and that a rainy backup plan was non-negotiable. The event was a hit, and I felt like a superhero.
You don’t need a giant corporation to use big data. You can use it to decide what to cook for dinner based on what you’ve eaten this week, or to figure out the best time to post on Instagram based on your past engagement. It’s about taking all that noise and turning it into a signal. I’ve started using free tools like Google Analytics for my blog and even just the “insights” tab on my social media. It’s wild how much you can learn when you stop guessing and start looking.
And honestly? The biggest lesson I’ve learned is that data doesn’t have to be cold or intimidating. It’s actually a form of self-care. When you know your numbers—whether it’s your savings, your sleep, or your sales—you give yourself the power to make choices that serve you. You stop feeling like a passenger in your own life and start holding the steering wheel.
So here’s my heartfelt takeaway: Don’t be afraid of the data. Start small. Pick one thing you want to understand better—maybe it’s your mood, your spending, or your time. Track it for a week. Make a simple chart. See what story it tells you. You might be surprised at how much clarity and calm that little bit of awareness brings. Data isn’t just for analysts or CEOs. It’s for anyone who wants to live a little more intentionally. And that includes you, my friend. 🤍