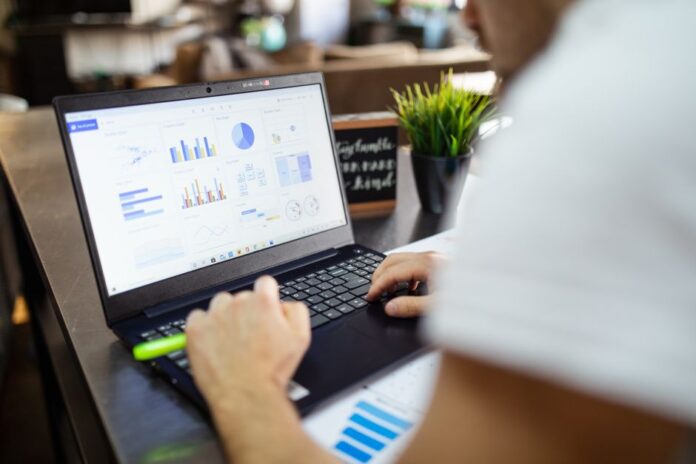
Okay, let me be real with you for a second. If someone had told me five years ago that I’d be sitting here, on a Tuesday morning, genuinely excited about data visualization and KPI tracking, I would have laughed—probably while clutching my third cup of coffee and a sticky note that said “I’ll figure it out later.” I’ve always been a “go with the gut” kind of girl. You know, the one who picks a restaurant based on the vibe, plans vacations by throwing darts at a map, and runs her small business by… well, hoping for the best. But then life (and my bank account) gave me a gentle, not-so-gentle nudge. So grab your tea, curl up, and let me tell you how I fell in love with the nerdy side of life—and why it’s actually the most empowering thing I’ve ever done.
The Day My Gut Lied to Me (And a Bar Chart Saved My Sanity)
Picture this: It’s last November. I’m launching my little online shop for handmade candles, and I’m feeling like a rockstar. I’ve posted three times a day on Instagram, bought a bunch of ads, and even hired a friend to film a “behind-the-scenes” reel. Sales? Crickets. I was convinced the problem was my product—maybe the lavender scent was too strong? Or the jars were too small? I was spiraling, girl. I spent a whole weekend redesigning labels and crying into my wax melts.
Then, a friend who’s a total business nerd said, “Emma, stop guessing. Show me your numbers.” So I reluctantly opened Google Analytics and a spreadsheet I’d been avoiding like a dentist appointment. And there it was: a simple bar chart. It showed that 80% of my website visitors were coming from Pinterest, not Instagram. My gut had me pouring all my energy into the wrong platform. I felt so silly, but also… relieved. That little bar chart wasn’t a boring graph—it was a flashlight in a dark room. Data visualization, my friends, is like having a best friend who tells you the truth, even when it hurts. Now I use tools like Canva’s simple charts or even a color-coded sticky note wall to see my patterns. It’s not about being a math genius; it’s about letting the numbers whisper what your heart can’t see.
Predictive Analytics: My Crystal Ball (That Actually Works)
I used to think predictive analytics was something only tech giants or fortune tellers used. Like, “Hey, AI, will I get a boyfriend this year?” But then I started tracking my monthly sales for my blog’s digital products—planners, e-books, that sort of thing. After six months of data, I noticed a pattern: every January, sales dipped, but every March, they spiked like crazy. I had no idea why. Maybe people were broke after the holidays? Or maybe spring made everyone want to organize their lives?
So I did a little experiment. I used a free tool (Google Trends plus a simple spreadsheet formula) to predict that March spike. I prepped my content, scheduled my emails, and even ordered extra inventory. And guess what? It worked. Sales were up 40% compared to the previous year. I felt like a wizard. But really, I was just using historical data to make a smart guess—that’s predictive analytics in a nutshell. It’s not magic; it’s just paying attention to your own story. For you, it might be noticing that your freelance clients always book you in September, or that your Etsy shop gets quiet in July. Track it, even if it’s just in a notebook. Your future self will thank you.
KPI Tracking and Business Intelligence: The Glow-Up You Didn’t Know You Needed
Okay, I’ll admit it—I used to roll my eyes at the term “KPI.” It sounded like something a corporate boss would say while wearing a suit and drinking kale juice. But then I realized: KPIs are just your personal cheerleaders. They’re the things that tell you, “Hey, you’re doing great,” or “Maybe pivot a little.” For me, my favorite KPI isn’t revenue—it’s “returning customer rate.” Because when someone buys from me twice, I know I’m not just a transaction; I’m a part of their life.
Business intelligence sounds fancy, but honestly? It’s just asking smart questions. Like, “Why did my email open rate drop last week?” or “Which blog post got the most comments?” I use a simple dashboard (I’m obsessed with Notion for this) where I track three numbers: website traffic, email subscribers, and customer feedback score. That’s it. Big data doesn’t have to be big. It can be small and intimate, like a diary entry. The key is to stop collecting data for the sake of it and start using it to make decisions that feel good. For example, I noticed my best-selling candle scent is “Vanilla Chai.” So now I make more of that and less of “Eucalyptus Mint” (sorry, mint lovers). That’s business intelligence with a side of self-care.
I remember a moment last summer when I was at a coffee shop, staring at my phone, feeling overwhelmed by all the numbers. A friend asked what I was doing, and I said, “Trying to figure out my life.” She laughed and said, “You’re just trying to figure out your data.” And she was right. It’s not about becoming a spreadsheet robot. It’s about using these tools to free up your brain for the fun stuff—the creativity, the connection, the joy.
So here’s my heartfelt takeaway, sweet friend: You don’t need to be a data scientist to be smart with your life or your business. You just need to be curious. Start with one number that matters to you—maybe it’s how many times you smiled today, or how many people read your latest post. Track it. Look at it. Let it guide you, not control you. Because at the end of the day, data is just a story waiting to be told. And you are the author. So go ahead, grab that spreadsheet, or that notebook, or that colorful chart. You’ve got this. 🤍