Okay, can we be real for a second? I used to think “data” was a four-letter word. My eyes would glaze over the moment someone mentioned “business intelligence” or “predictive analytics.” I’d nod politely while my brain screamed, “Just tell me if my blog post is working or not!” But then, something shifted. Maybe it was the sheer overwhelm of trying to track everything in my head (spoiler: it didn’t work), or maybe it was the day I realized I was making decisions based on vibes and caffeine levels. Either way, I fell down a rabbit hole, and I’m here to tell you—it’s not as scary as it sounds. In fact, it’s kind of… fun? Grab your favorite mug, and let’s chat about how I turned data from a chore into my secret weapon.
The Day My Spreadsheet Cried (And How I Met Big Data)
Picture this: It’s a rainy Tuesday afternoon. I’m staring at a Google Sheet with 47 columns of blog metrics—page views, bounce rates, social shares, email sign-ups, you name it. My cursor is blinking, and I have absolutely no idea what any of it means. I feel like I’m trying to read a foreign language written in hieroglyphics. That was my “aha” moment. I realized that collecting data without understanding it is like hoarding cookbooks but never cooking a meal. You have all the ingredients, but you’re still hungry.
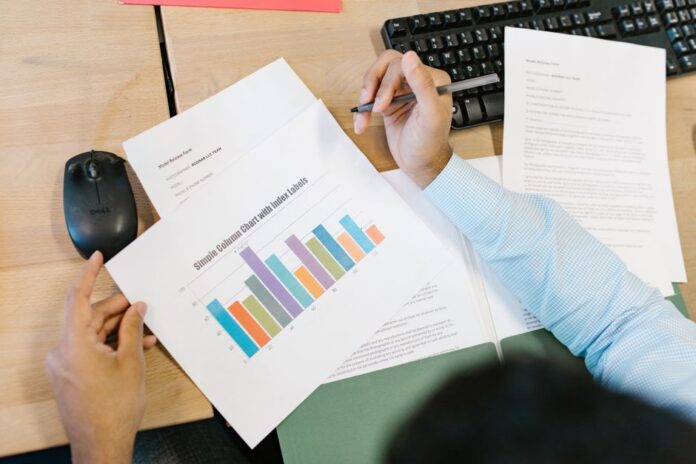
So, I took a deep breath and started with data visualization. And let me tell you, it was a game-changer. Instead of rows and rows of numbers, I started using simple bar charts and line graphs to see my traffic trends. Suddenly, I could tell at a glance that my Thursday posts were getting twice the love as my Monday ones. It felt like putting on glasses for the first time—everything came into focus. I even made a little dashboard for myself using a free tool, and now I check it like I check my Instagram feed. It’s oddly satisfying. Big data doesn’t have to be intimidating; it’s just your story told in numbers.
Predictive Analytics: My Crystal Ball (Minus the Magic)
Now, let’s talk about the fancy stuff—predictive analytics. I know, it sounds like something a tech wizard would use, but hear me out. A few months ago, I was planning my content calendar for the holiday season. I had no idea what topics would actually resonate with you all. So, I looked at my past year’s data: which posts got the most shares, what keywords you were searching for, and even what time of day you were reading. Using some basic patterns, I made an educated guess that “cozy winter recipes” and “budget-friendly gift guides” would be hits. I was right! Those posts became my top performers. It wasn’t magic—it was just me using historical data to make a smart bet.
Here’s the relatable part: I’m not a data scientist. I’m a girl who once forgot her own Wi-Fi password. But predictive analytics is just about asking, “What happened before, and what might happen next?” You can do this with your own life too. For example, I track my energy levels in a simple journal, and I’ve noticed I’m most productive between 9 and 11 AM. Now I schedule my hardest tasks then. That’s predictive analytics for your personal life! It’s not about being perfect; it’s about being a little smarter with your time.
KPI Tracking and Business Intelligence: Your North Star
Okay, let’s get to the part that sounds the most corporate: KPI tracking and business intelligence. I used to think KPIs were just for CEOs in boardrooms, but honestly? They’re for anyone who wants to know if they’re moving forward. My key performance indicators are simple: email open rate, blog comments, and how many of you actually click the links I share. That’s it. I don’t need a million metrics. I just need a few that tell me if I’m connecting with you.
Business intelligence, in my world, means using those KPIs to make decisions. For instance, when I noticed my email open rate was dropping, I didn’t panic. I looked at the data and saw that my subject lines were too long. I shortened them, added a little emoji, and boom—open rates went up. That’s business intelligence at work: using your own data to get better. It’s like having a friend who gently tells you when you have spinach in your teeth. It’s not judgmental; it’s helpful.
I’ll be honest: I still have days where I just want to ignore the numbers and write whatever I feel. And that’s okay! Data is a tool, not a master. It’s there to guide you, not to dictate every move. The goal isn’t to become a robot who only follows charts. The goal is to use these insights to free up more time for what you love—whether that’s creating, connecting, or just taking a nap.
So here’s my heartfelt takeaway: You don’t have to be a spreadsheet wizard to harness the power of data. Start small. Pick one metric that matters to you—maybe it’s how many people smile at your posts or how often you feel energized after a project. Track it in a way that feels natural, like a sticky note on your mirror or a simple graph in a notebook. Let the data whisper to you, not shout. And remember, you’re the author of your story. The numbers are just the ink. Use them to write something beautiful.
Now go make your data work for you, not the other way around. You’ve got this. 🤍